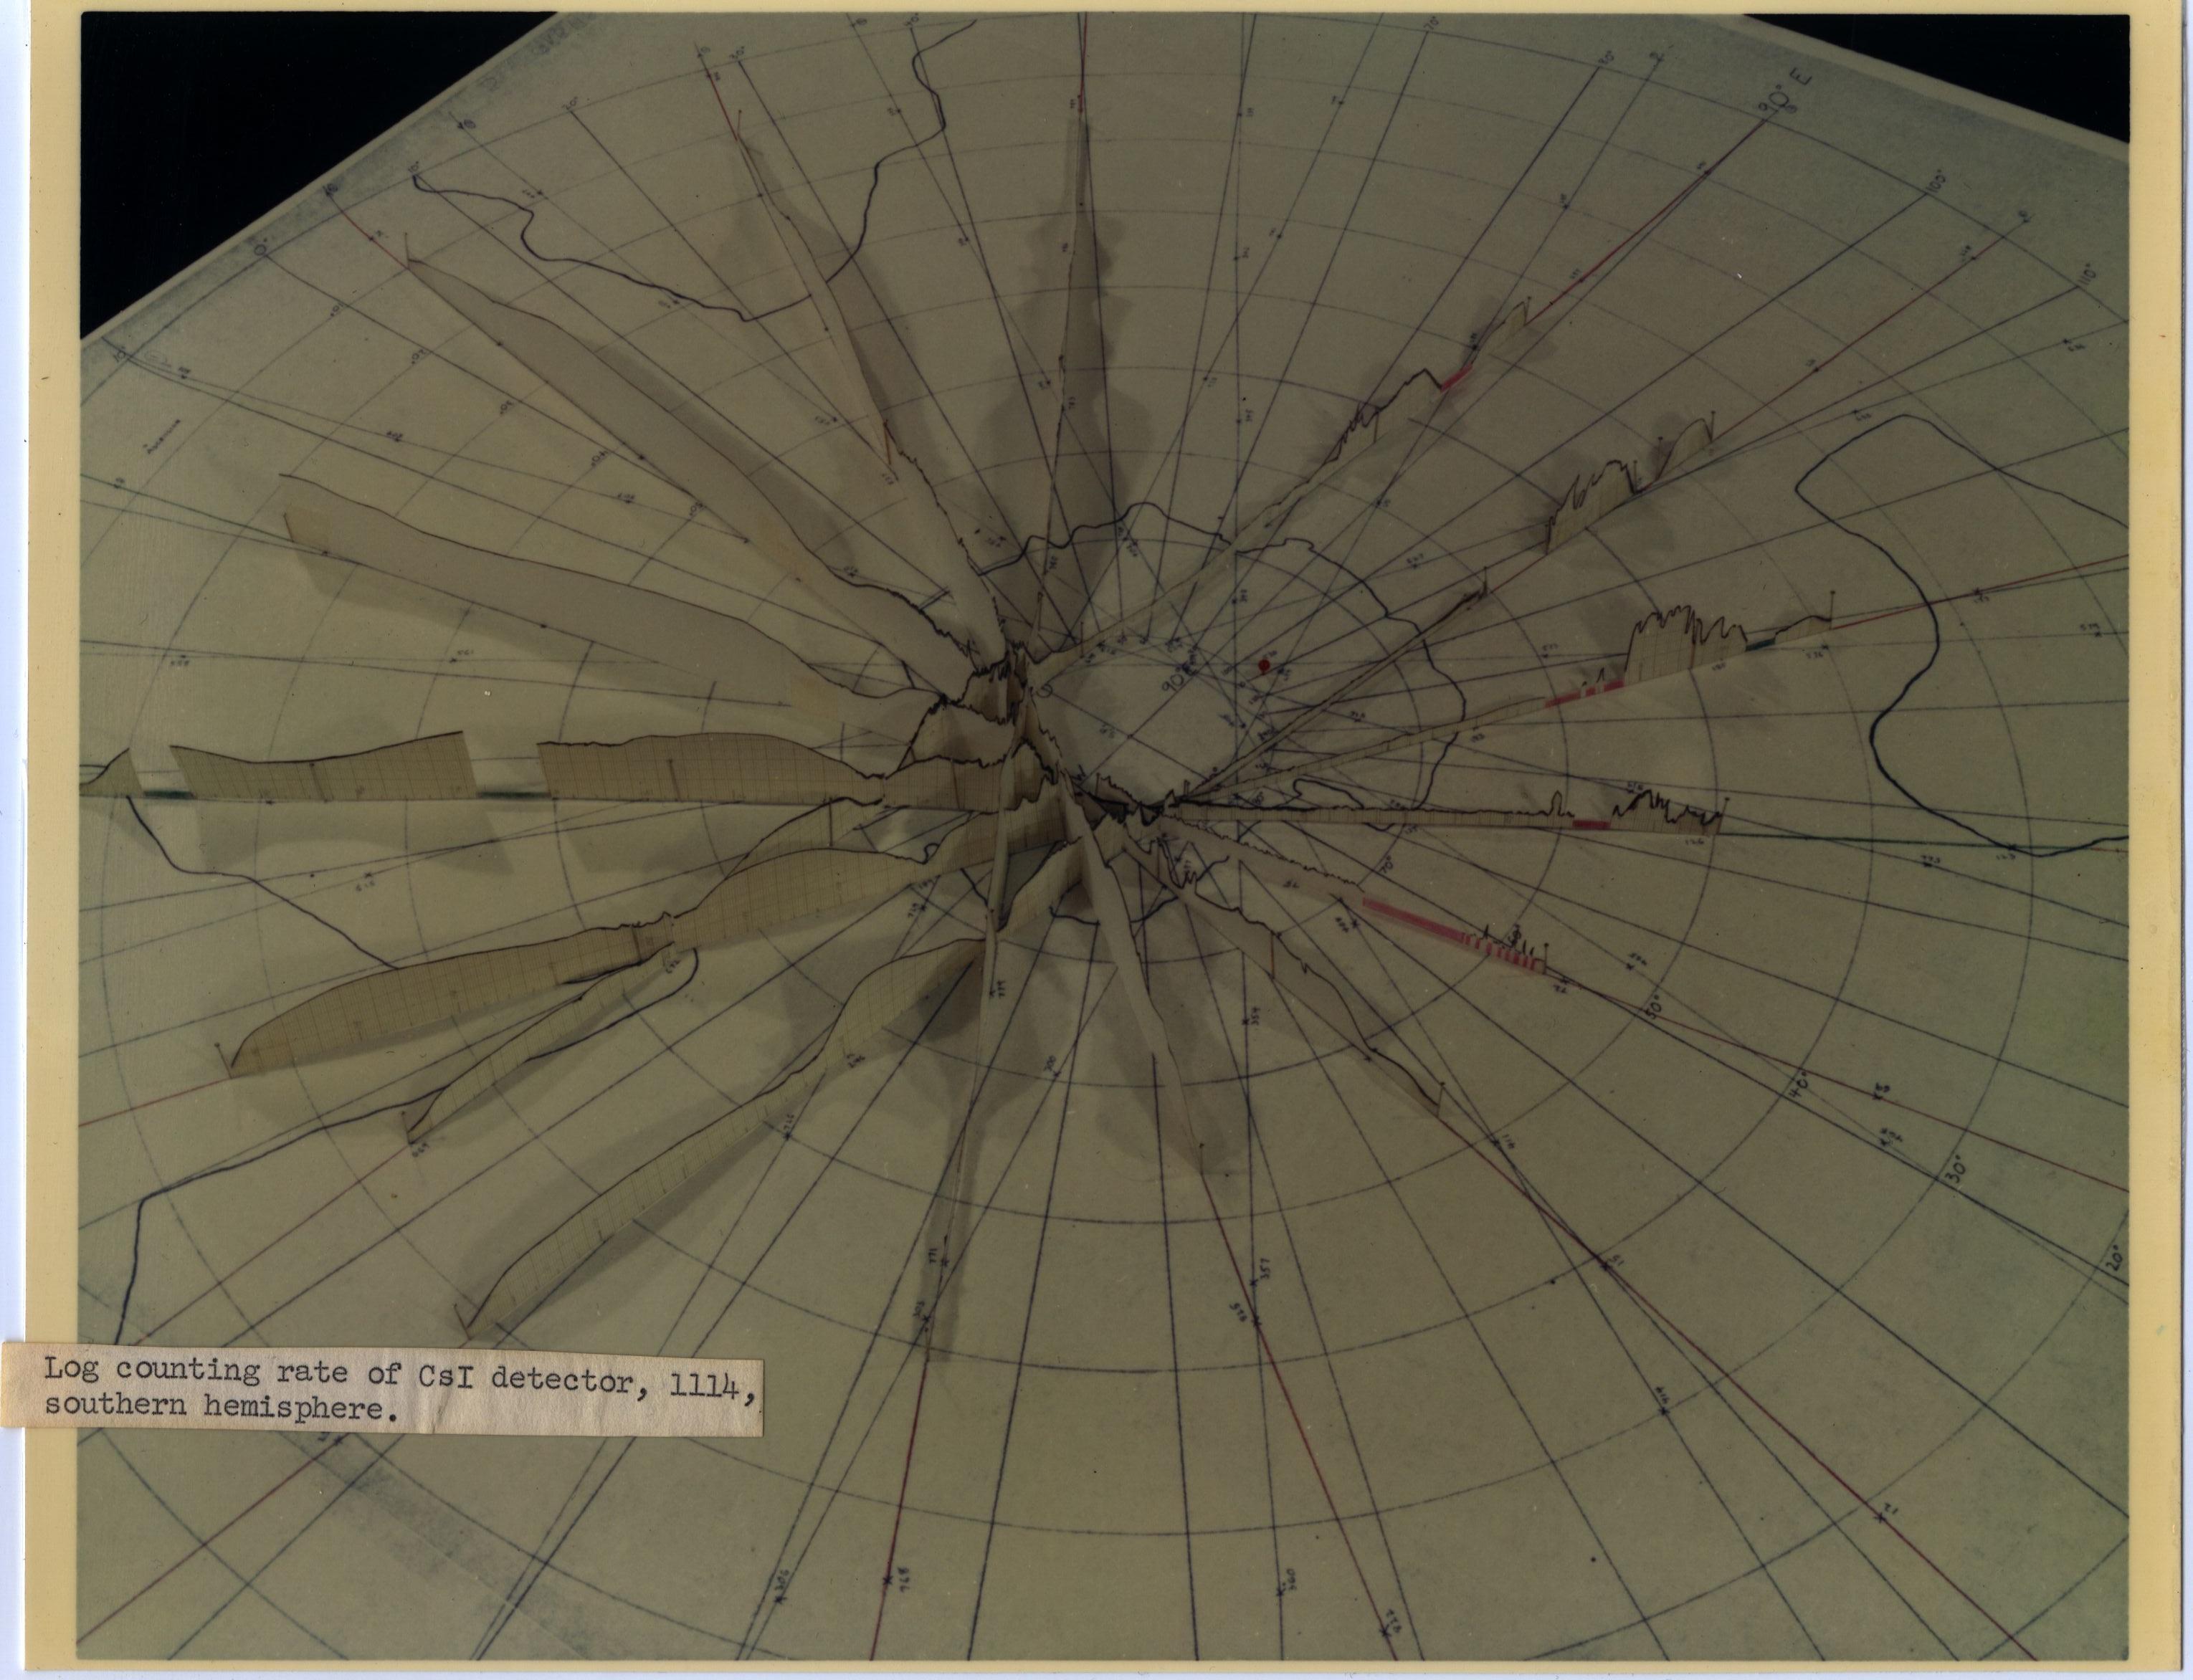
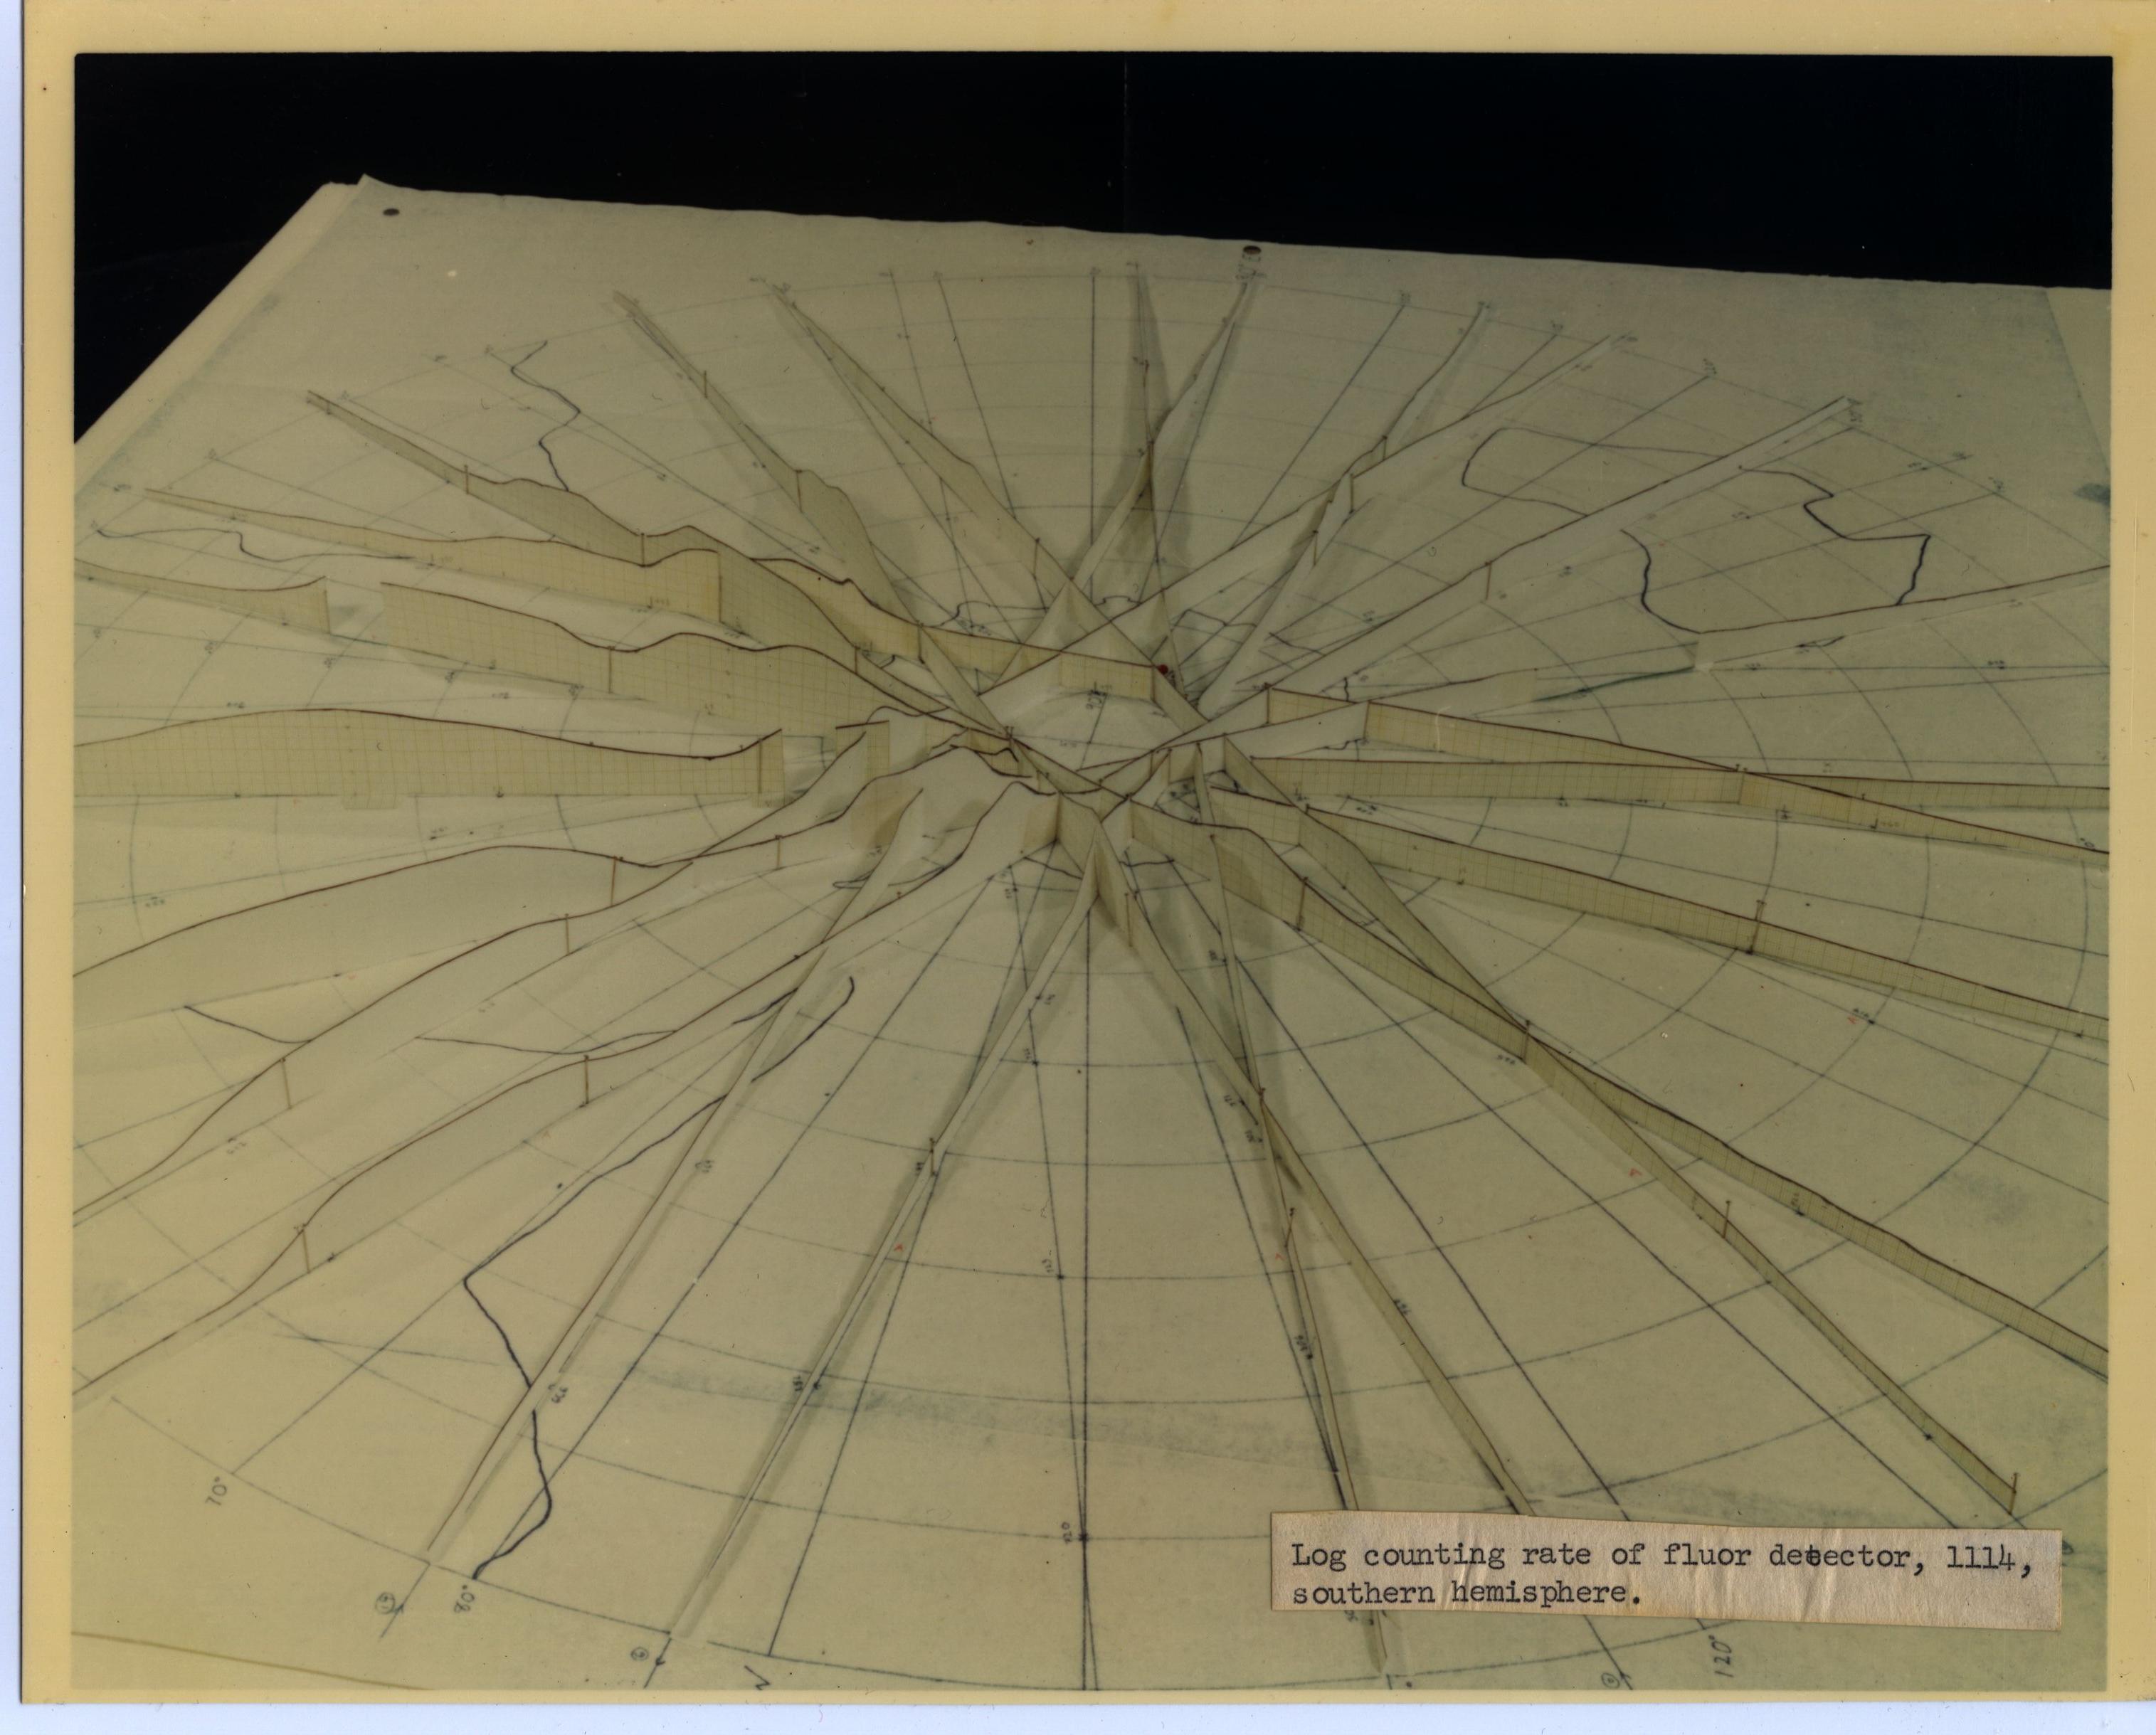
These three-dimensional plots represent the intensity of radiation as a function of geographic position. For each orbital pass, a graph of intensity versus ground track position was cut out and pasted on card. By standing up the card strips on a map for each pass, a surface of intensity versus position was built up. The SAA can be clearly seen in these plots, made in 1961.